1
2
3
4
5
6
7
8
9
10
11
12
13
14
15
16
17
18
19
20
21
22
23
24
25
26
27
28
29
30
31
32
33
34
35
36
37
38
39
40
41
42
43
44
45
46
47
48
49
50
51
52
53
54
55
56
57
58
59
60
61
62
63
64
65
66
67
68
69
70
71
72
73
74
75
76
77
78
79
80
81
82
83
84
85
86
87
88
89
90
91
92
| import numpy as np
import numpy as np
import pandas as pd
import matplotlib.pyplot as plt
from scipy.optimize import curve_fit
def date_encode(date):
d = date.split('/')
return int(d[1]),int(d[2])
def date_decode(date):
return '{}.{}'.format(str(date // 100), str(date % 100))
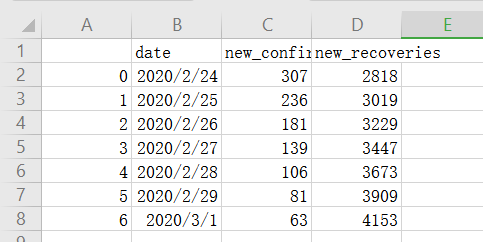
df = pd.read_csv('data.csv')
df.drop([33],inplace=True)
X = np.array(df.iloc[:,0])
cur_month,cur_day=date_encode(X[0])
y = np.array(df['total_confirmed'])
z= np.array(df['new_recoveries'])
x = np.arange(len(y))
def get_date_list(cur_month,cur_day,days,prediction=7):
"""
得到原始数据和预测的日期
"""
month_day = [0, 31, 29, 31, 30, 31, 30, 31, 31, 30, 31, 30, 31]
ans = []
n=days+prediction
while n:
if cur_day <= month_day[cur_month]:
d = "0" + str(cur_day) if cur_day < 10 else str(cur_day)
ans += [str(cur_month) + "/" + d]
cur_day += 1
n=n-1
else:
cur_day = 1
cur_month += 1
n=n-1
return ans
ans = get_date_list(cur_month,cur_day,len(y),prediction=7)
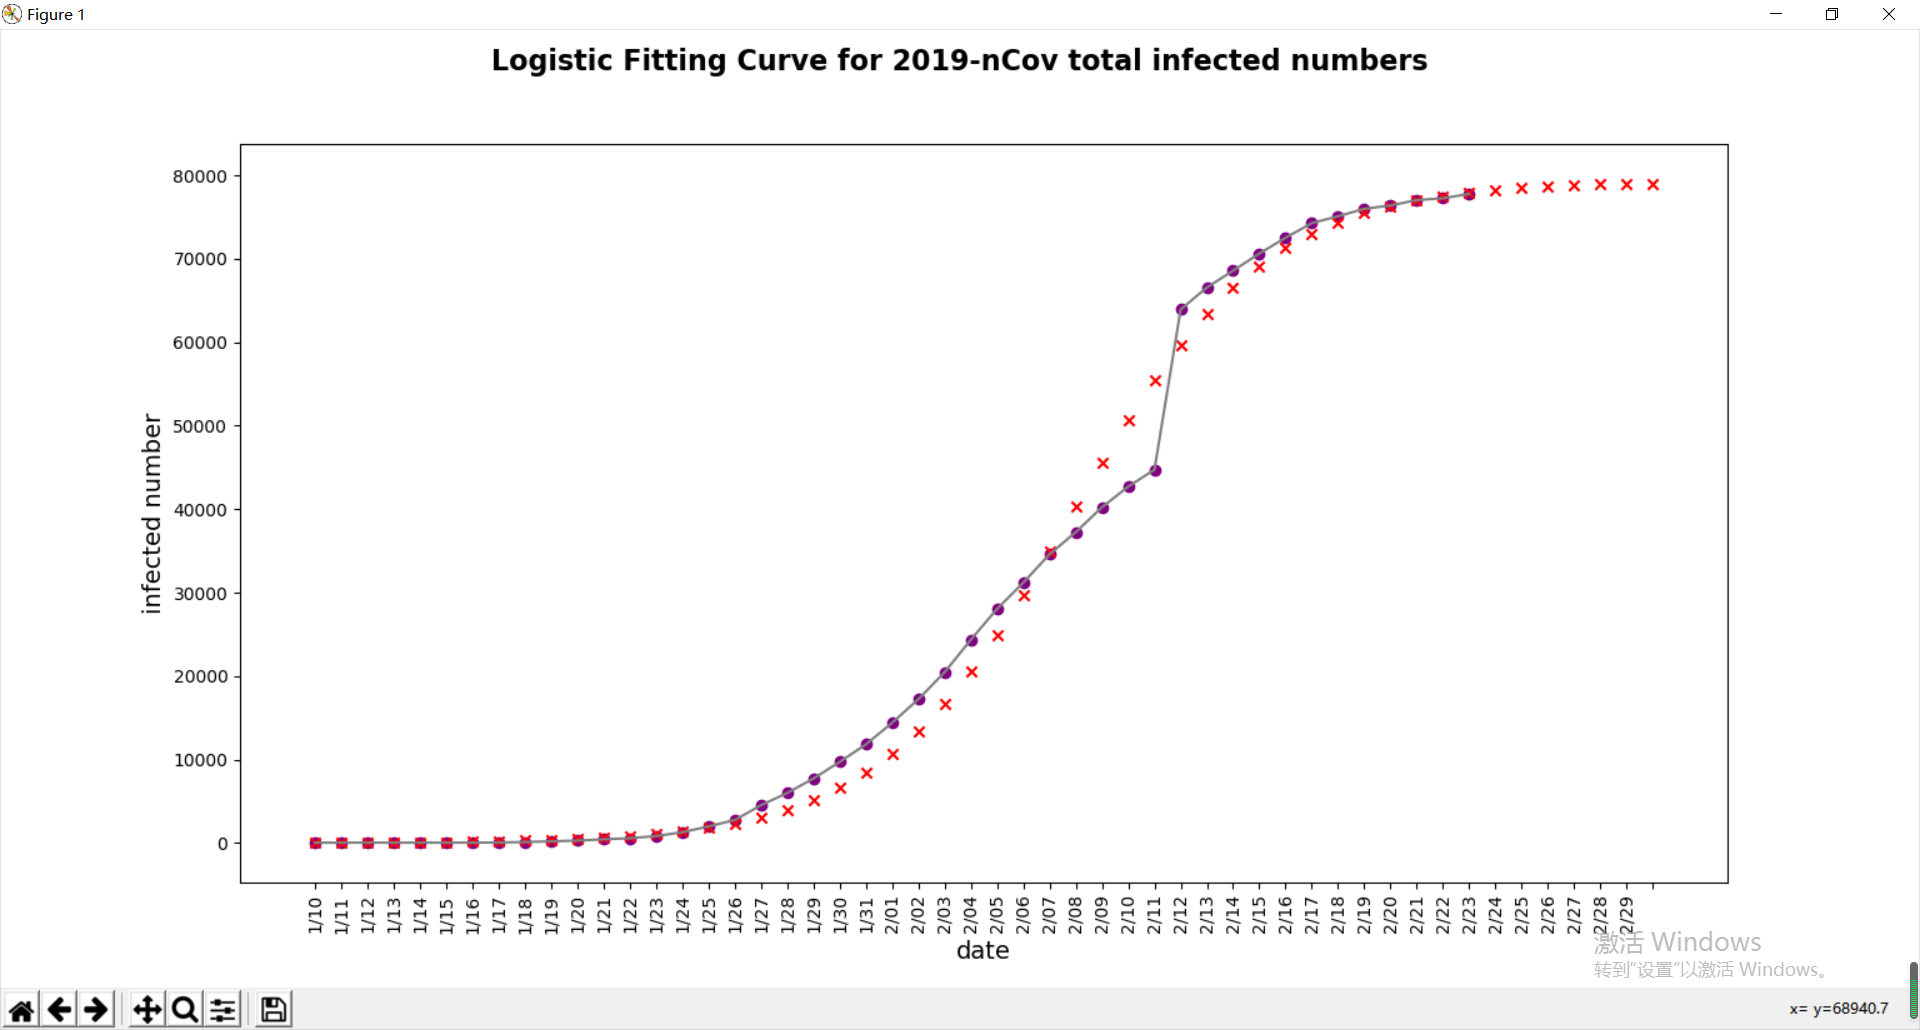
def logistic_function(t, K, P0, r):
r=0.27
t0 = 0
exp = np.exp(r * (t - t0))
return (K * exp * P0) / (K + (exp - 1) * P0)
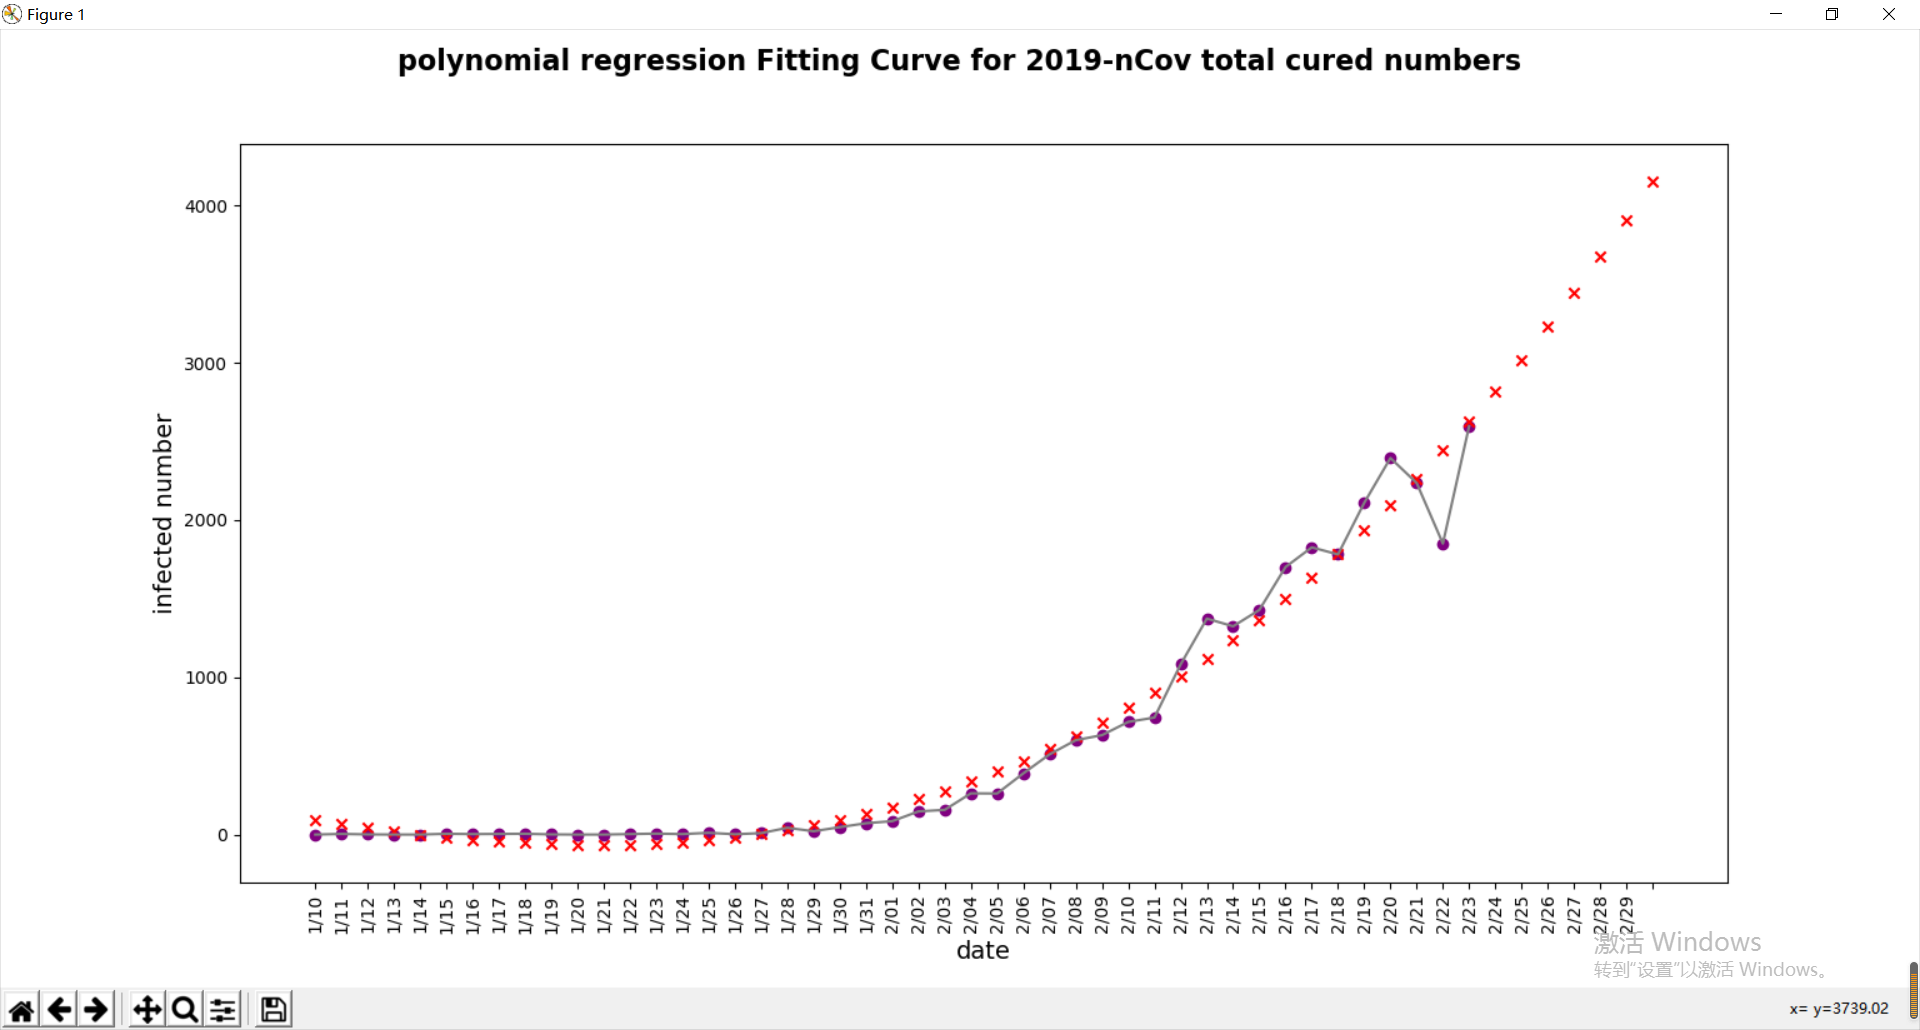
def f_3(x, A, B, C, D):
return A*x*x*x + B*x*x + C*x + D
popt, pcov = curve_fit(logistic_function, x, y)
popt1, pcov1 = curve_fit(f_3, x, z)
predict_x = list(x)+[x[-1] + i for i in range(1, 8)]
predict_x = np.array(predict_x)
predict_y = logistic_function(predict_x, popt[0], popt[1], popt[2])
predict_y = [int(i) for i in predict_y]
predict_z = f_3(predict_x, popt1[0], popt1[1], popt1[2],popt1[3])
predict_z = [int(i) for i in predict_z]
new_infected = [predict_y[i]-predict_y[i-1] for i in range(-7,0)]
print(ans[-7:],new_infected)
new_cured = [predict_z[i]-predict_z[i-1] for i in range(-7,0)]
print(ans[-7:],new_cured)
plt.scatter(x,z,color='purple',label='real')
plt.plot(x,z,color='gray')
plt.scatter(predict_x,predict_z,marker='x',color='red',label='predicted data')
plt.xticks(predict_x,ans,rotation=90)
plt.suptitle("polynomial regression Fitting Curve for 2019-nCov total cured numbers", fontsize=16, fontweight="bold")
plt.xlabel('date', fontsize=14)
plt.ylabel('infected number', fontsize=14)
plt.show()
|